Use geometric objects as matplotlib paths and patches
Project Links
Meta
Author: Sean Gillies
Classifiers
Development Status
- 5 - Production/Stable
Intended Audience
- Developers
- Science/Research
License
- OSI Approved :: BSD License
Operating System
- OS Independent
Programming Language
- Python
- Python :: 2
- Python :: 3
Topic
- Scientific/Engineering :: GIS
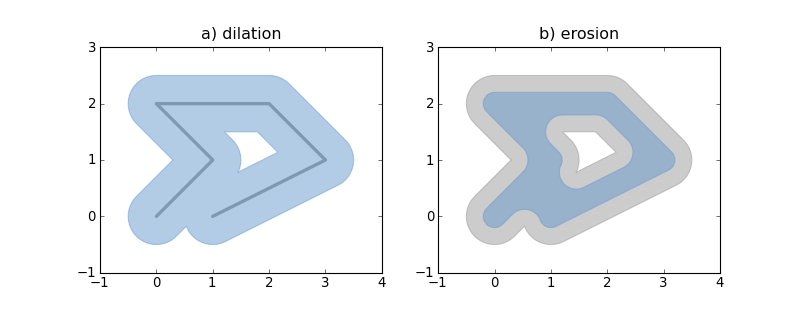
Use Shapely or GeoJSON-like geometric objects as matplotlib paths and patches
Requires: matplotlib, numpy, and optionally Shapely 1.2+.
Example:
from matplotlib import pyplot
from shapely.geometry import LineString
from descartes import PolygonPatch

BLUE = '#6699cc'
GRAY = '#999999'

def plot_line(ax, ob):
    x, y = ob.xy
    ax.plot(x, y, color=GRAY, linewidth=3, solid_capstyle='round', zorder=1)

line = LineString([(0, 0), (1, 1), (0, 2), (2, 2), (3, 1), (1, 0)])

fig = pyplot.figure(1, figsize=(10, 4), dpi=180)

# 1
ax = fig.add_subplot(121)

plot_line(ax, line)

dilated = line.buffer(0.5)
patch1 = PolygonPatch(dilated, fc=BLUE, ec=BLUE, alpha=0.5, zorder=2)
ax.add_patch(patch1)

#2
ax = fig.add_subplot(122)

patch2a = PolygonPatch(dilated, fc=GRAY, ec=GRAY, alpha=0.5, zorder=1)
ax.add_patch(patch2a)

eroded = dilated.buffer(-0.3)

# GeoJSON-like data works as well

polygon = eroded.__geo_interface__
# >>> geo['type']
# 'Polygon'
# >>> geo['coordinates'][0][:2]
# ((0.50502525316941682, 0.78786796564403572), (0.5247963548222736, 0.8096820147509064))
patch2b = PolygonPatch(polygon, fc=BLUE, ec=BLUE, alpha=0.5, zorder=2)
ax.add_patch(patch2b)

pyplot.show()
See also: examples/patches.py.
Descartes is not associated with the identically named and apparently defunct project at http://descartes.sourceforge.net/.
1.1.0
Jan 17, 2017
1.0.2
Feb 19, 2016
1.0.1
Dec 08, 2013
1.0
Apr 26, 2010
0.1.2
Apr 09, 2010
0.1.1
Apr 08, 2010
0.1
Apr 08, 2010
Wheel compatibility matrix
Files in release
Extras:
None
Dependencies: